The network profit loss (NPL) indicator (brown line above) by Santiment is a very interesting one that I’ve just discovered. I really recommend reading this article to get a sense of what it is.
Basically, network profit loss indicates to us whether most people are taking profits or losses from their trades at any single moment. If the mechanics behind this indicator is sound1, it is truly a novel indicator of Defi. NPL is derived by taking every coin on the blockchain and making the assumption that the price at which it last moved is its acquisition price, and the price at which its currently transacted at is its ‘sell’ price - therefore deriving the ROI. From the ROI, we get a rolling image of overall ’network’ profitability.
From here on, I’ll assume you understand how it works in order to begin using it to shed light on the recent market sell off. If you don’t, read that article above.
Background
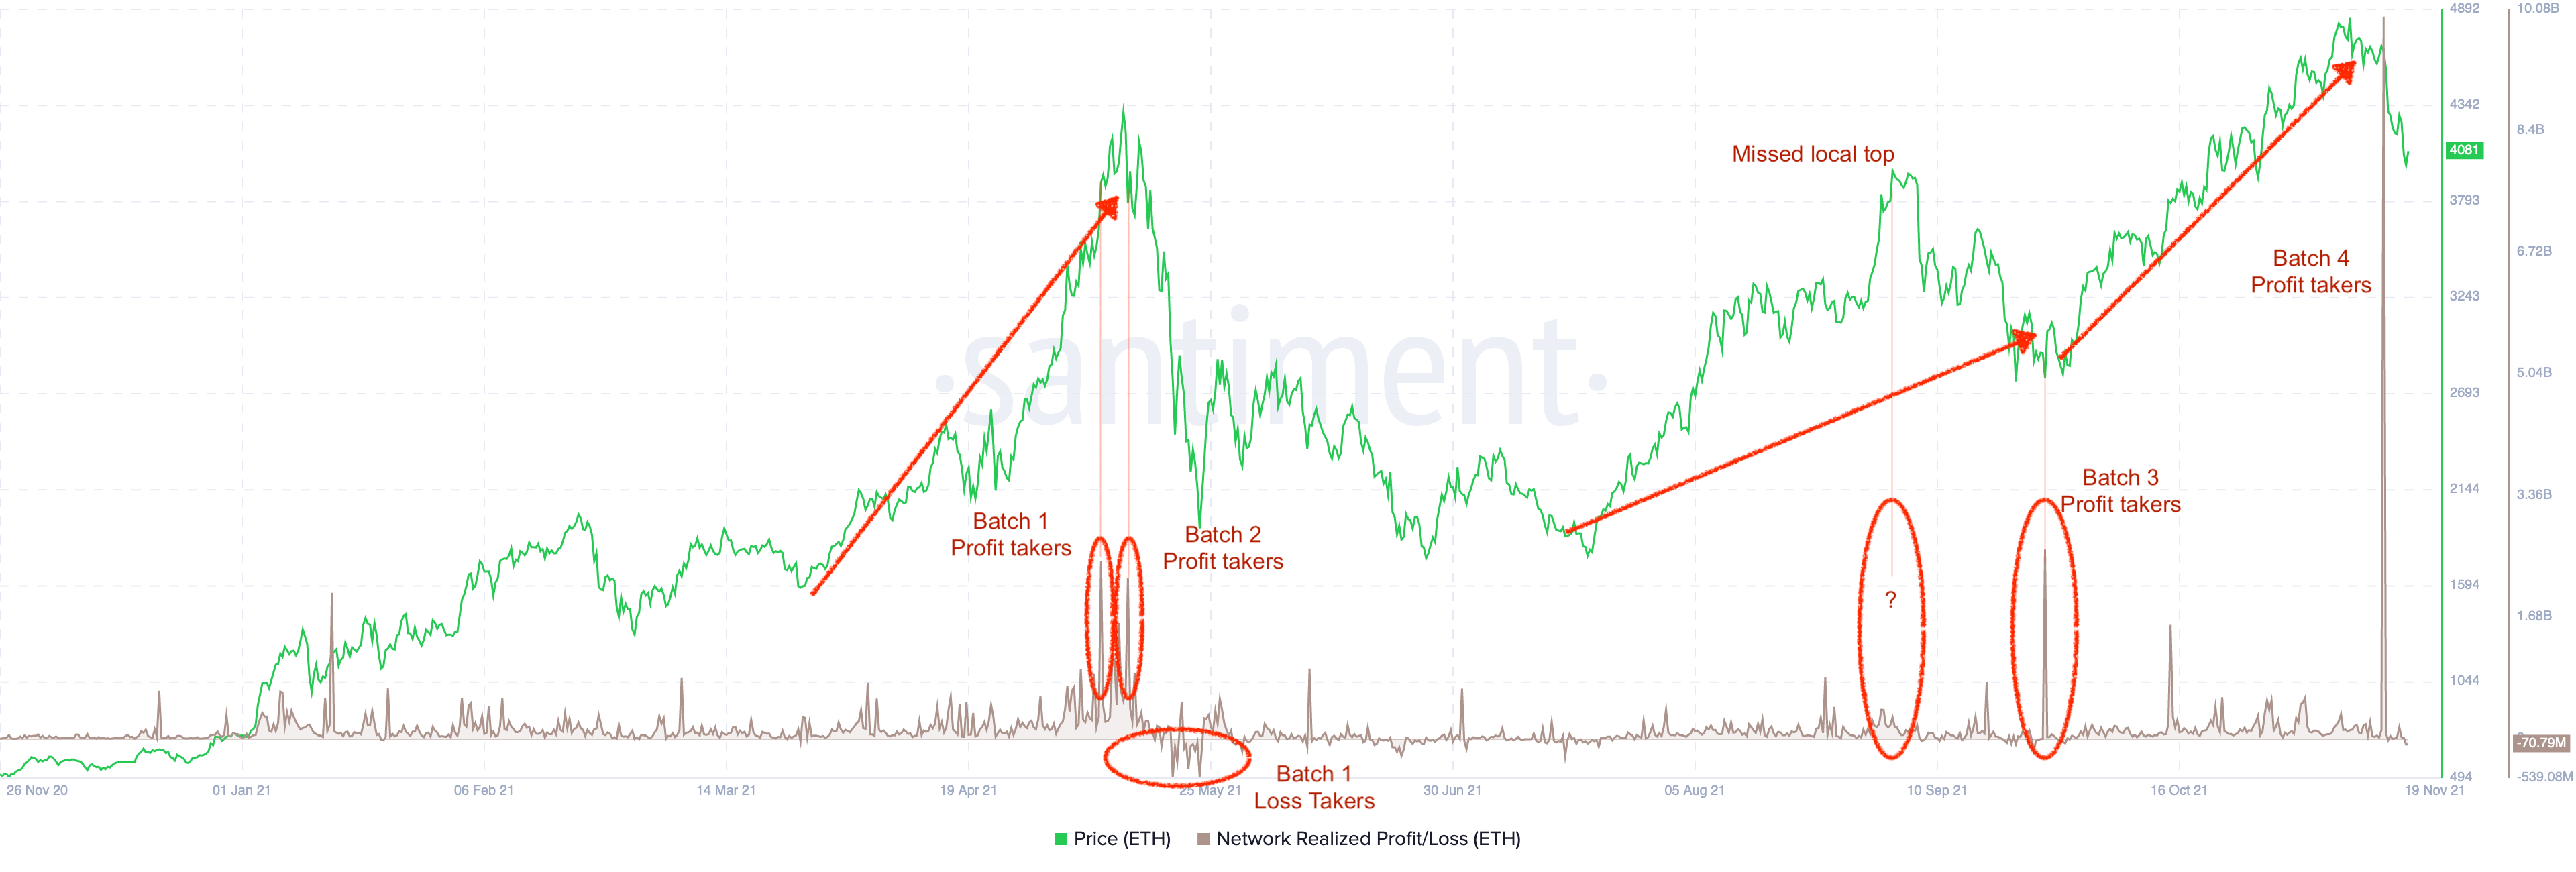
We see that generally, there will be spikes in NPL during local tops. In mid-May this year, for instance, there were two distinct spikes. The first one occured when Eth rallied sharply to 3800, breaking all time high. Many sold their Eth to realize profits. The second one occurred right after Eth shot up to 4300 a few days later and fell sharply back to 3800 on about 14th May. This was a wake up call to those that failed to bag profits on the rally up. Realizing that it’s still a really good time to bag profits despite missing ATH, they sold off their Eth. They were smart to do so, as the May crash ensued and subsequent people who sold off on the way down suffered moderate losses (Batch one loss takers).
Fast forward a couple of months to late September, we observe Batch 3 Profit takers taking profits. Despite missing the local top of 5th September and seeing prices going down to 2.8k, Batch 3 profit takers decided that it’s better to take profits then than to expose themselves to the risk of Eth falling further. In doing so, they’ve missed a further (rather unexpected tbh) rally of the last 2 months, from September to mid November - but maintained an overall profit from their trades.
15 Nov Sell-Off
On 15 Nov, we observe a huge NPL spike with a value amounting to 9.91Bn. It turned out that this was caused by Ethereum foundation transferring 20000 Eth (worth $6 Bn) to Kraken, followed by a ‘mysterious whale’ that also sold 2b worth of Eth.
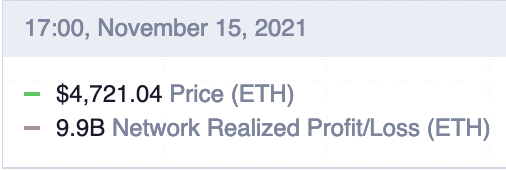
On the day alone, holders of Eth bagged a 9.9Bn profit.
This was interpreted as a topping signal and triggered a further round of sell-off. Spikes in NPL indicate that holders are bagging their profits. When that happens, markets find it harder to absorb the higher sell pressure as less people are willing to buy tokens at a premium during a rally - resulting in falls in prices, which is what we observed in the last two days.
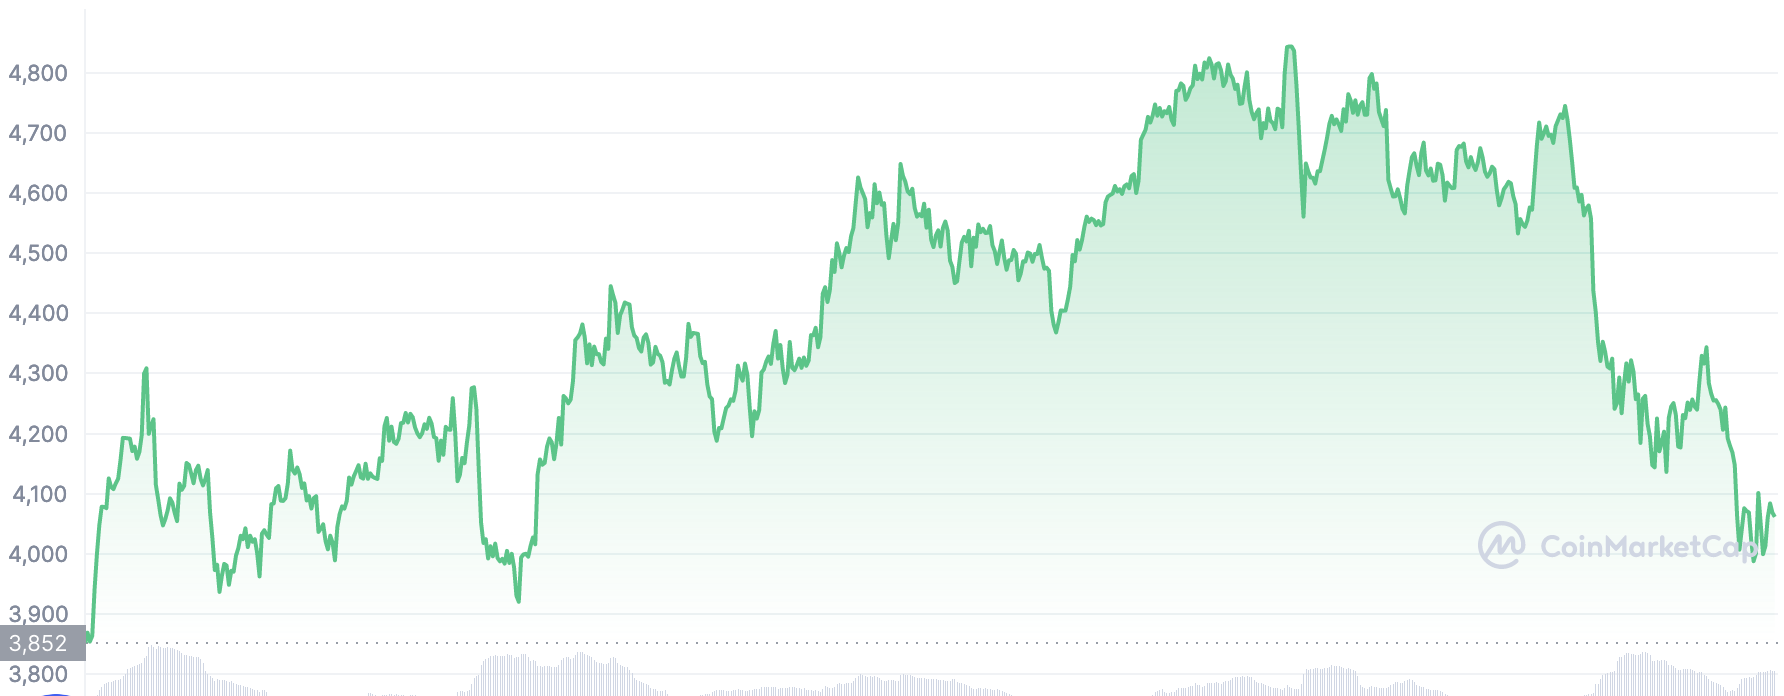
For reference, here is the Eth charts for the last two days. It has already fallen 18% from ATH in a matter of 4 days.
So - in this short article, we have seen the power of NPL in giving us a topping signal. Historically, spikes in NPL indicate local tops. The recent market sell-off is not simply due to sales of tokens by the Ethereum foundation: they - and other who have chosen to sell on 15th Nov - have realized a large amount of profits from that trade.
What does it tell us? The market has topped. If you’re holding, calculate whether it makes sense for you to cut loss at this point before a further sell off. If you’re looking to enter the market, wait till there is ‘blood’ on the streets, indicated by negative NPL spikes.
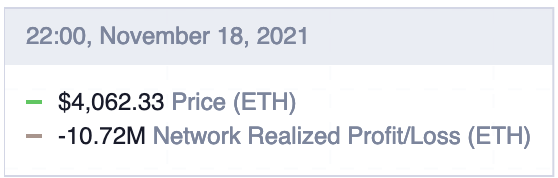
As of yesterday and today, NPL is already in negative territory.
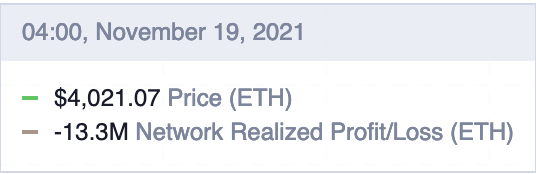
To give a relative sense of context, at the time of the May market crash, losses were taken at around 100M to 150M per day in terms of NPL.
That’s how much blood there was. Right now, it’s just a small bruise. So probably need to wait for there to be more blood first.
Stay safe guys.
A question I had when I initially read this definition is: how do you track the infinite divisibility of coins within a network? Let’s say, you want to track Coin Number #1 of an ERC token. Coin 1 is currently split up into 1000 parts, all in different wallets, and bundled in differing transactions. When you trace the ROI of one coin, do you mean you’re analyzing each miniscule fragment of that coin in 1000 different wallets, or do you break down a particular transaction by the price at which each composable unit of the coin is being acquired at? So many questions. Are all coins within a network tracked, or did we do sampling here? The mechanics of this metric is very interesting. Anyway, I shall move on to the main topic of this article: using this metric to shed some insight on the recent market sell-off. ↩︎