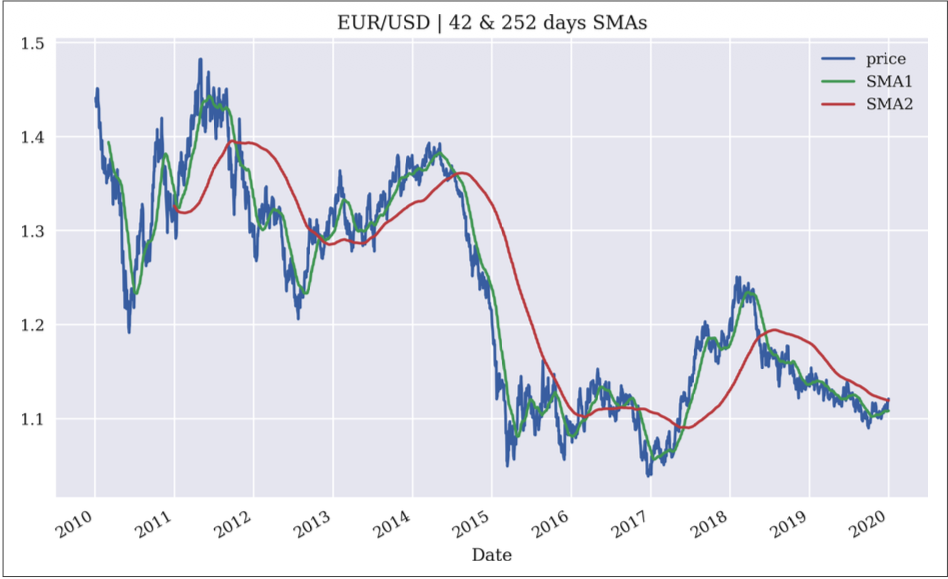
One of the SMA (simple moving average) strategies proposed in the Hilpisch book goes like this: we construct 2 SMA indicators, one short (42 days) and one long (252 days), and whenever the short indicator is above the long indicator (indicative that recent tide is bullish), we take a long position, and whenever the long indicator is above the short indicator (the reverse), we take a short position.
In the book example, they looked at 10 year data of EUR/USD pair. Whenever the green line is above the red line, we maintain a long position; whenever the green line dips below the red line, we maintain a short position:
Adding some annotations, we see that this logic seems to be riding the wave all the way:
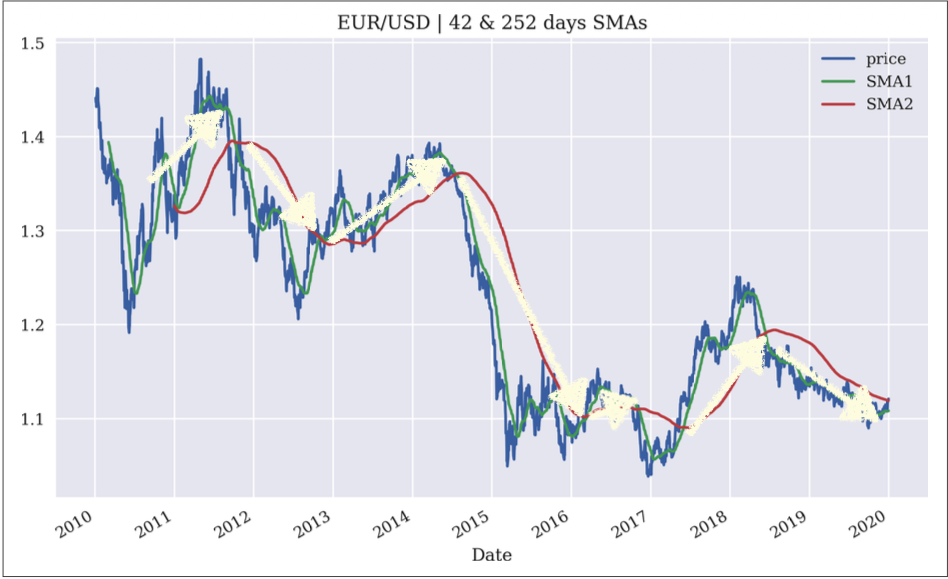
For all the ‘bullish’ signals (green>red), we’re longing, for all the ‘bearish’ signals, we’re shorting (red>green).
How convenient! The result is that our strategy returns 1.28x, whilst the stock price itself fell to 0.83x.
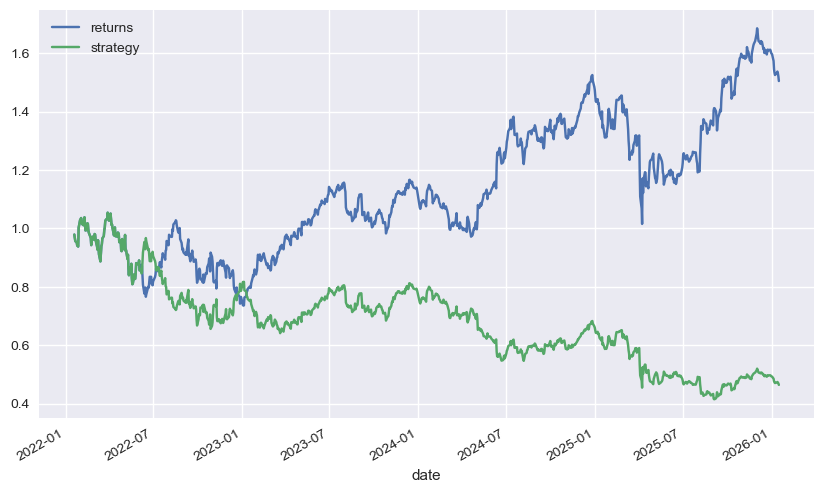
I tried to replicate this for AAPL stock, for a 4 year period between 1/16/2022 to 1/16/2026, but I got dismal results.
| |
Whilst the stock returns is 1.5x, my returns are 0.46x.
Why is that the case? The following chart provides some kind of explanation:
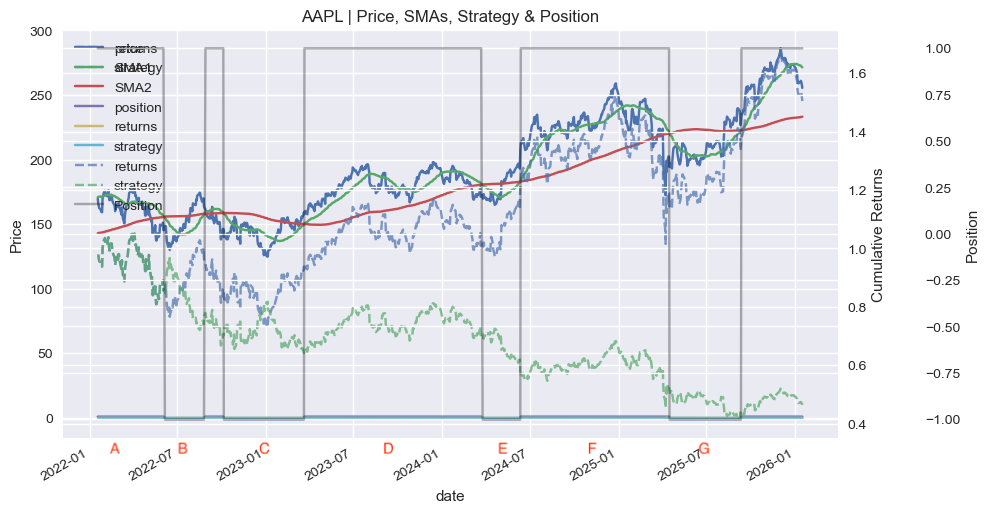
On the top section of the graph, you see the price, SMA1 and SMA2 lines. Below, the dotted blue and green lines show the cumulative returns of the stock and strategy respectively. The grey line depicts long and short positions based on calculations according to our rule. Various regions are labeled A to G.
The general finding is that there are several “short” regions where the gap really pulled apart. For instance, region B, E, and G, saw the greatest divergences.
In all of these cases, it does seem like somewhere in the middle of the region, the gap seemed to shrink, before expanding by the time we ‘flip’ our positions.
Our exit strategy seems a little too late. By the time the short SMA passes over the long SMA, market surge has already taken away significant value in our short.
So now the question is, is it possible to exit earlier? For instance, by exiting when the slope of the SMA flips?
I feel like there’s a problem with this logic. Because what does it then do to my previous positions? I feel like in this case, this becomes a position that is simply using 1 SMA. In fact - would this be more profitable?
Let’s say I construct my position such that whenever the sign of SMA1 becomes positive, we take a long, and vice versa.
This then becomes a purely momentum based strategy.
A lot of questions to ponder. I think I won’t do bespoke implementation for now, I will try to learn a bit more first, and try to see whether those strategies are profitable on other price charts.